



Your new model is finished. Someone asks the only question that matters: is it actually good enough to ship? At SQUER, the honest answer used to live in five disconnected places. This is the story of how we replaced that sprawl with a single LLM evaluation framework — and what we learned about taming the metric zoo.
The question that has no easy answer
Every model we build, for ourselves or for a customer, eventually meets the same moment. The training is done, the demo looks great, and someone asks whether it is good enough. Not "does it run," but: is it more accurate than the last version, is it safe, is it cheaper, will it hold up in production?
When we tried to answer those questions for our own models, we quickly realized no single evaluation framework could cover everything we needed. We wanted something that could combine different kinds of metrics, stay simple to extend as new requirements appeared, and avoid reinventing the wheel every time. A factory pattern felt like the obvious choice: ask for the metrics you need, and get exactly those metrics. But as those requirements kept growing, so did the design, and what started as a simple factory eventually became SQUER Metrics.
How the metric zoo grows
Nobody sets out to build a zoo. It grows one reasonable decision at a time.
It started, as these things do, with a simple script to gather the metrics we cared about. Then production realities arrived: the script had to survive flaky APIs, so we added retries and rate limiting. Then we needed to compare several models on several tasks at once, so a single sequential loop was no longer enough; we needed metrics applied dynamically per use case and every task running in parallel. Then we wanted judge-based comparisons to be repeatable, so we needed somewhere to cache references.
Each step was justified. The sum was a tangle. And the deeper problem was not the engineering, it was that performance, usability, reliability, toxicity, integrity, and safety were each measured by a different tool, in a different way, at a different stage. Selection used one set of numbers, testing used another, and long-run observability used a third. There was no through-line from "which model should we pick?" to "is the one in production still behaving?"
The turn: we didn't need more metrics, we needed one place for them
The breakthrough was realizing what the problem was not. It was not a shortage of good metrics. The ecosystem is overflowing with them. HuggingFace's evaluate hub alone wraps most classic scorers; BERTScore and BLEURT capture semantic quality; Detoxify quantifies toxicity; RapidFuzz measures edit effort; and LLM-as-a-judge can grade nuance that none of those reach.
The problem was that these lived in incompatible worlds. You could not import any of them, choose the right subset for a given use case, and then carry the same numbers from model selection through testing and into production. That missing layer — not another metric, but a place to unify the ones that already exist — is what we set out to build.
So the design goal for SQUER Metrics became deliberately narrow: a pluggable metric registry that can import whatever is out there, select metrics per use case, run everything in parallel across any provider, and write every result to one reproducible file. The clear separation between the evaluator interface and the metrics themselves is what lets the same framework stretch from a laptop experiment to production monitoring.
SQUER Metrics: one registry to tame the zoo
Architecturally, the framework is the embodiment of that one idea. A Typer CLI collects inputs. The backend loads environment, config, and use cases, prepares the metrics each use case asks for, and dispatches provider–use case pairs in parallel. Providers — OpenAI, AWS Bedrock, or any local OpenAI-compatible endpoint — return outputs that the metric engine scores, and results are flushed to a JSONL file. Config, cases, and run files are produced as artifacts along the way.

The heart of the diagram is the Metric Engine. register_metric is the doorway through which any scorer — a classic overlap metric, a safety classifier, an LLM judge — enters the system and becomes selectable by name. The Provider Layer plays the same trick for models: one send_prompt interface, many backends behind it.
A run, end to end
Walk a single use case through the system and the story becomes concrete. A run loads its environment, config, and cases; if there are no cases or no providers, it exits cleanly rather than producing a misleading empty result. Otherwise it merges the metrics each use case requested, creates a timestamped run file, and queues one task per provider–use case pair.

Each worker respects the rate limiter and retry policy, invokes its provider, scores the output against the metrics that use case asked for, and appends one EvalResult line under a lock, so parallel writes never corrupt the file. The class model below shows how the pieces relate: a Configuration of providers and a judge, a ProviderFactory that builds them, and a Metric hierarchy where every scorer is just another implementation behind one compute method.
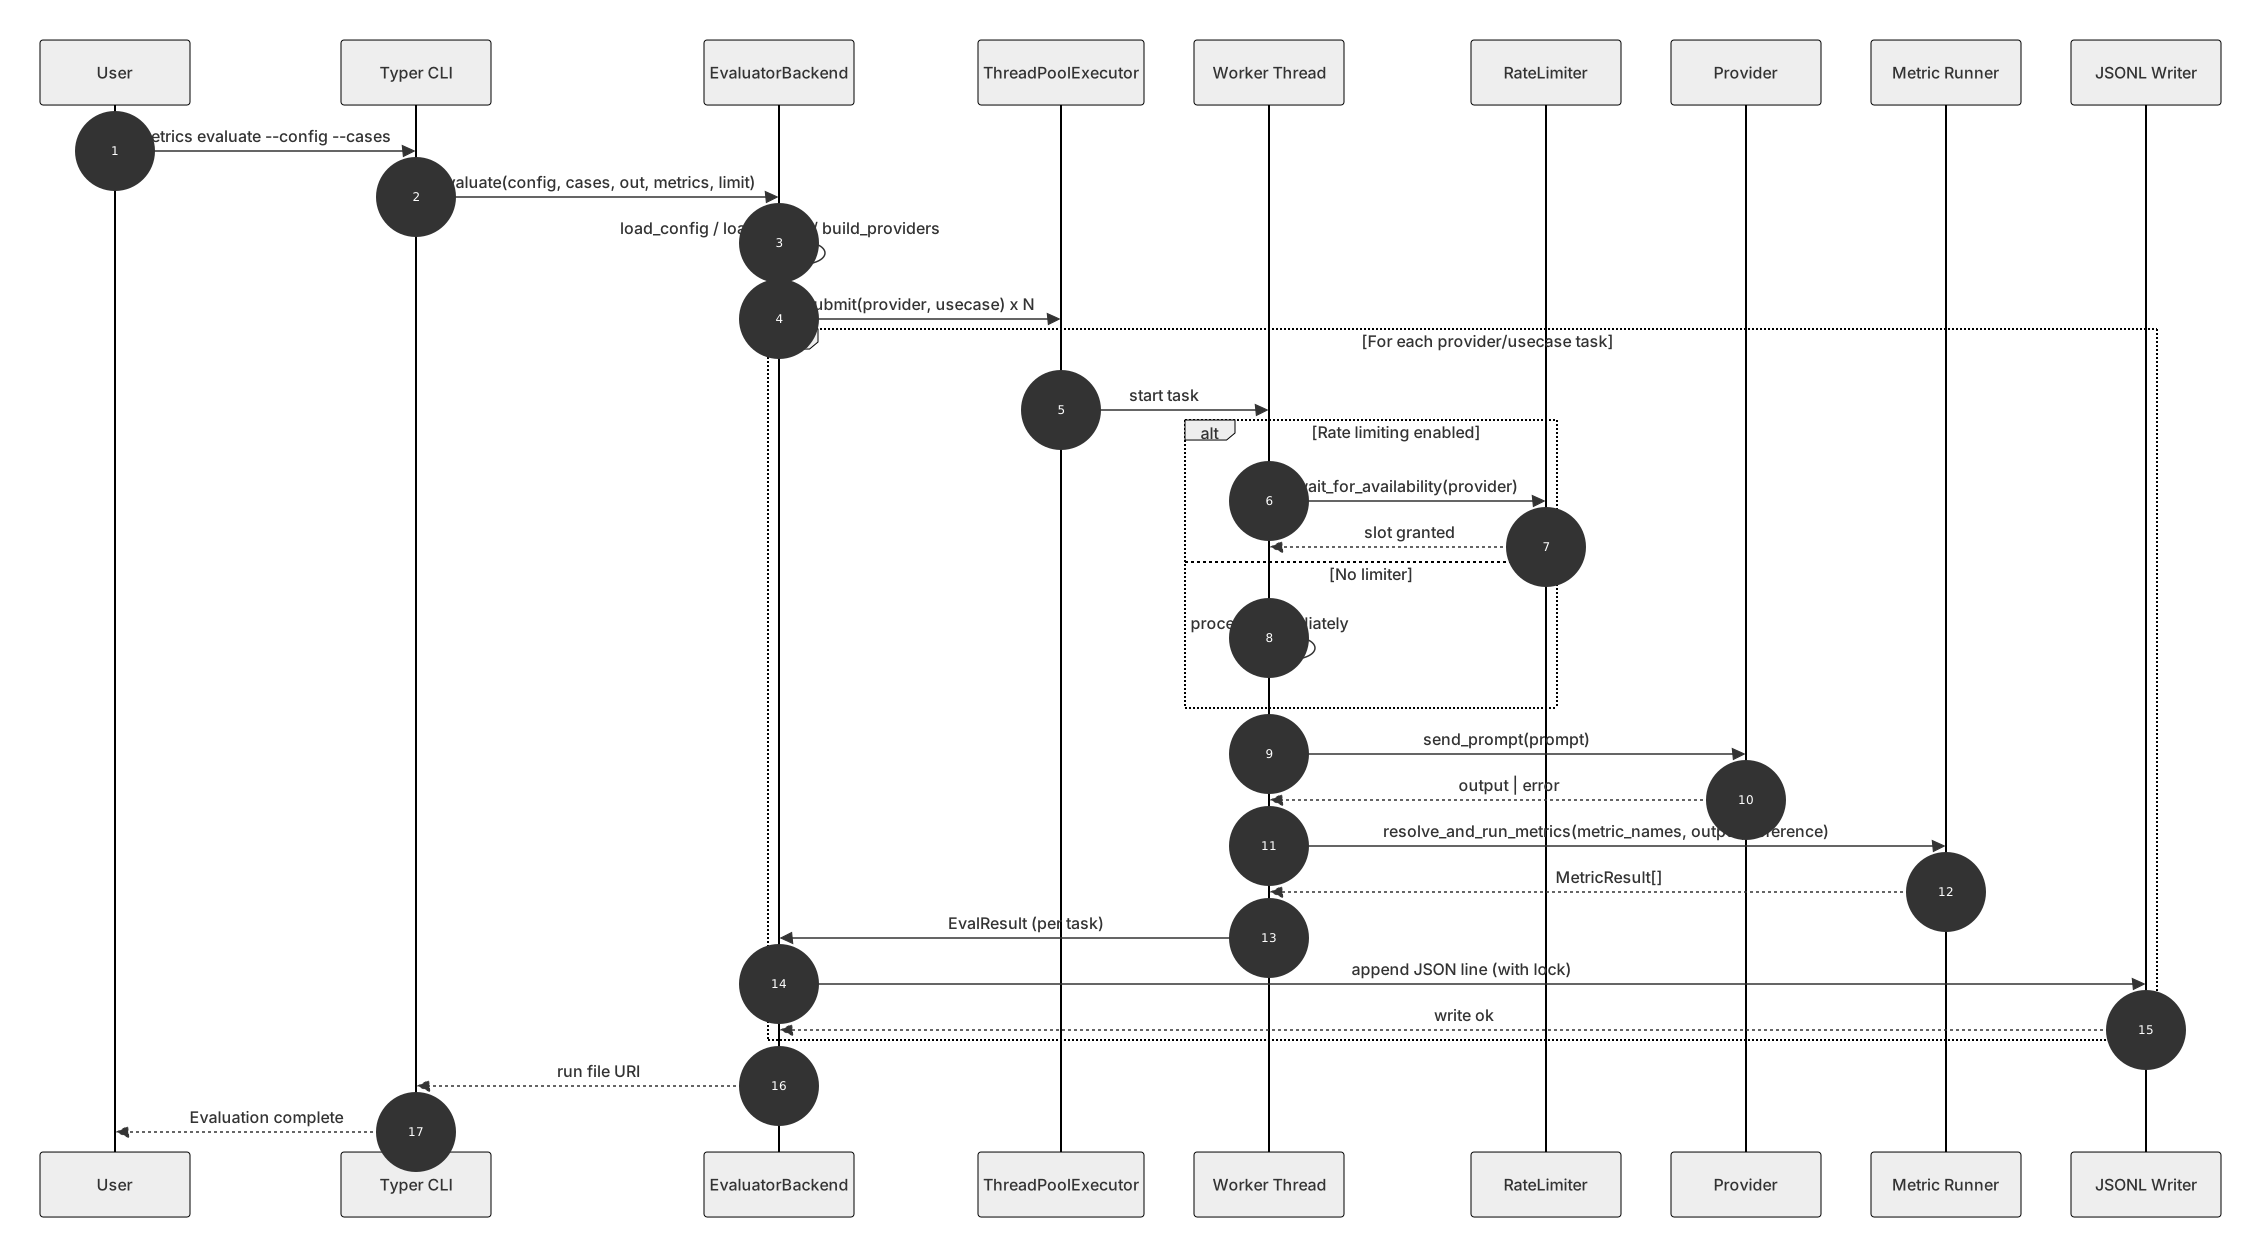
Sequenced over time, the same run looks like this: the CLI hands off to the backend, the backend fans work out to a thread pool, and each worker passes through the rate limiter before touching a provider:
[IMAGE PLACEHOLDER 4 – Sequence diagram: User, Typer CLI, EvaluatorBackend, ThreadPoolExecutor, Worker, RateLimiter, Provider, Metric Runner, JSONL Writer]
Because the work is parallel but bounded, resource use stays predictable. The charts below come from a sample run: memory holds a steady sawtooth well under its peak, and a handful of worker threads stay busy from start to finish.
1xychart
2    title "Memory Usage During Evaluator Run"
3    x-axis "Time (s)" [4.220, 4.561, 4.785, 6.496, 6.580, 6.870, 8.060, 9.397, 9.735, 10.273, 10.770, 11.946, 12.139, 13.099, 14.180, 14.541, 14.736, 16.010, 16.203, 17.055, 18.685, 18.697, 19.041, 20.045, 21.136, 21.314, 22.112, 23.120, 23.582, 23.939, 24.792, 25.854, 26.056, 27.737, 28.048, 28.196, 29.495, 30.486, 30.656, 32.409, 32.453, 32.647, 33.836, 34.852, 35.028, 36.014, 37.033, 37.211, 38.251, 39.173, 39.356, 40.025, 40.943, 41.072, 41.929, 42.882, 43.087, 43.926, 44.480, 45.274, 46.404, 46.578, 47.568, 48.535, 48.714, 49.769, 50.731, 50.906, 52.631, 52.999, 53.138, 54.168, 55.277, 55.517, 56.166, 57.387, 57.553, 58.179, 59.141, 59.388, 60.174, 61.551, 61.919, 62.288, 63.126, 64.236, 64.592, 64.816, 66.038, 67.391, 67.780, 68.172, 68.962, 70.046, 70.243, 72.241, 72.617, 72.684, 73.863, 75.102, 75.542, 75.751, 77.050, 78.036, 78.241, 79.742, 79.947, 80.168, 82.183, 82.515, 82.724, 83.687, 84.608, 84.781, 85.585, 86.515]
4    y-axis "Memory (MiB)"
5    line "Current" [99.05, 79.89, 59.03, 99.92, 79.36, 59.10, 87.39, 99.65, 79.93, 85.40, 59.27, 79.05, 59.31, 59.33, 101.66, 79.46, 59.43, 79.20, 59.47, 59.55, 99.93, 79.28, 59.57, 59.61, 79.46, 59.65, 59.68, 91.65, 79.45, 59.73, 59.80, 79.45, 59.68, 99.19, 80.53, 59.75, 59.83, 80.04, 59.83, 100.79, 80.16, 59.91, 59.96, 80.03, 59.96, 60.06, 80.14, 60.05, 60.14, 79.88, 60.15, 60.21, 81.22, 60.23, 60.28, 80.20, 60.31, 82.32, 60.33, 60.36, 80.53, 60.38, 60.47, 80.60, 60.46, 60.55, 80.63, 60.53, 100.04, 81.44, 60.60, 60.69, 80.41, 70.43, 60.76, 81.61, 79.67, 60.81, 80.89, 60.72, 60.76, 81.65, 80.52, 60.82, 60.87, 104.88, 80.59, 60.88, 60.96, 81.83, 80.71, 61.01, 61.06, 80.94, 61.06, 101.54, 82.00, 61.14, 61.19, 103.91, 81.27, 61.22, 61.29, 81.04, 61.30, 100.82, 81.09, 61.36, 100.89, 81.16, 61.45, 61.53, 81.73, 61.54, 61.55, 61.55]
6    line "Peak" [138.69, 138.69, 138.69, 140.29, 140.29, 140.29, 140.29, 140.29, 140.29, 140.29, 140.29, 140.29, 140.29, 140.29, 140.29, 140.29, 140.29, 140.29, 140.29, 140.29, 140.29, 140.29, 140.29, 140.29, 140.29, 140.29, 140.29, 140.29, 140.29, 140.29, 140.29, 140.29, 140.29, 141.91, 141.91, 141.91, 141.91, 141.91, 141.91, 141.91, 141.91, 141.91, 141.91, 141.91, 141.91, 141.91, 141.91, 141.91, 141.91, 141.91, 141.91, 141.91, 141.91, 141.91, 141.91, 141.91, 141.91, 141.91, 141.91, 141.91, 141.91, 141.91, 141.91, 141.91, 141.91, 141.91, 143.53, 143.53, 143.53, 143.53, 143.53, 143.53, 143.53, 143.53, 143.53, 143.53, 143.53, 143.53, 143.53, 143.53, 143.53, 143.53, 143.53, 143.53, 143.53, 143.53, 143.53, 143.53, 143.53, 143.53, 143.53, 143.53, 143.53, 143.53, 143.53, 143.53, 143.53, 143.53, 143.53, 143.53, 143.53, 143.53, 143.53, 147.53, 147.53, 147.53, 147.53, 147.53, 147.53, 147.53, 147.53]
gantt
    title Thread Activity During Evaluator Run
    dateFormat  X
    section Threads
    MainThread            :active, 0, 87
    ThreadPoolExecutor_0_0:active, 0, 86
    ThreadPoolExecutor_0_1:active, 0, 86
    ThreadPoolExecutor_0_2:active, 0, 85
The zoo, tamed: the metrics reference (extra reads for those who are interested in the math)
This is where the registry pays off. Every metric below is just another animal in the same enclosure: registered by name, selectable per use case, and scored through one interface. Here is what each one measures, the equation behind it, and when to reach for it.
ROUGE (Recall-Oriented Understudy for Gisting Evaluation)
- What it measures: Token n-gram overlap between generated text and a reference summary.
- Equation: For each n-gram variant (ROUGE-1, ROUGE-2, ROUGE-L), we compute the F-score:
\[ F_1 = \frac{2PR}{P + R} \]
where precision \(P\) and recall \(R\) are the fractions of overlapping n-grams. The reported score in metrics.rouge is the average of the three F-scores:
\[ \mathrm{ROUGE} = \frac{F_1^{(1)} + F_1^{(2)} + F_1^{(L)}}{3} \]
- Direction: Higher is better. 1.0 indicates perfect overlap.
- Typical use case: Quick regression checks for summarization or instruction-following tasks where lexical overlap with curated references matters.
BERTScore
- What it measures: Semantic similarity between candidate and reference text using contextual embeddings.
- Equation: Tokens are embedded with a transformer model. Cosine similarities are aggregated into precision and recall, then combined as:
\[ F_1 = \frac{2PR}{P + R} \]
where \(P\) is the average maximum similarity from candidate tokens to reference tokens, and \(R\) is the reverse. The implementation uses bert_score.score defaults (roberta-large, baseline rescaling).
- Direction: Higher is better. Scores fall within \([0, 1]\) after rescaling.
- Typical use case: Detecting semantic regressions even when surface wording changes.
BLEURT (Optional)
- What it measures: Learned quality evaluation trained on human feedback.
- Equation: Outputs a scalar regression score directly from the BLEURT model. There is no closed-form expression beyond the neural network.
- Direction: Higher values indicate closer alignment with reference responses.
- Typical use case: When a project invests in the BLEURT setup to capture nuanced human-quality judgments that traditional overlap metrics miss.
TSR (Toxicity/Safety/Respect) Score
- What it measures: Safety by penalizing the highest predicted toxicity dimension.
- Equation: For Detoxify probability outputs \(p_i\) across toxicity labels, the score is:
\[ \mathrm{TSR} = 1 - \max_i p_i \]
Empty generations default to 1.0 (fully safe).
- Direction: Higher is better. 1.0 means the model assigns zero toxicity.
- Typical use case: Screening LLM responses in safety-sensitive deployments and monitoring safety regressions during model fine-tuning.
Effort to Fix
- What it measures: Edit effort between generated and reference text via normalized Levenshtein distance.
- Equation: Using RapidFuzz:
\[ \mathrm{EffortToFix} = d_{\mathrm{norm}}(c, r) \]
where \(d_{\mathrm{norm}}\) returns a value in \([0, 1]\) with 0 meaning identical strings and 1 indicating maximum edit distance. The metric also exposes the complementary similarity \(s_{\mathrm{norm}} = 1 - d_{\mathrm{norm}}\).
- Direction: Lower is better. 0.0 means no edits required.
- Typical use case: Measuring rework cost for generated outputs that humans must correct.
Selecting a metric
- Use ROUGE or BERTScore for content fidelity checks against written references.
- Add TSR whenever safety thresholds must be tracked automatically.
- Use Effort to Fix when human-in-the-loop editing burden is a primary KPI.
- Consider enabling BLEURT for human-aligned semantic quality once its dependencies are installed.
Additional metrics (with equations)
BLEU
- What it measures: n-gram precision with brevity penalty for machine translation or short-form generation.
- Equation: For modified n-gram precisions \(p_n\) and weights \(w_n\) (usually \(w_n=\tfrac{1}{4}\) for \(n=1..4\)), with brevity penalty \(\mathrm{BP}\):
\[ \mathrm{BLEU} = \mathrm{BP}\cdot \exp\!\left(\sum_{n=1}^N w_n \ln p_n\right),\quad \mathrm{BP} = \begin{cases} 1 & \text{if } c > r \\ \exp(1 - r/c) & \text{if } c \le r \end{cases} \]
where \(c\) is candidate length and \(r\) is reference length.
- Direction: Higher is better.
METEOR (summary)
- What it measures: Unigram precision/recall with stemming, synonyms, and a fragmentation penalty.
- Core scoring: A harmonic mean with recall-weight \(\alpha\) and penalty \(\mathrm{Pen}\) for chunkiness:
\[ \mathrm{METEOR} = (1 - \mathrm{Pen})\cdot \frac{PR}{\alpha P + (1-\alpha) R} \]
- Direction: Higher is better.
Exact Match (EM)
- What it measures: Binary exact string match to reference answer after normalization.
- Equation:
\[ \mathrm{EM}(c,r) = \begin{cases}1 & \text{if } \mathrm{norm}(c)=\mathrm{norm}(r)\\ 0 & \text{otherwise}\end{cases} \]
- Direction: Higher is better.
Token-level F1 (for QA)
- What it measures: Overlap between token sets of candidate and reference answers.
- Equation: With precision \(P=\tfrac{|c\cap r|}{|c|}\) and recall \(R=\tfrac{|c\cap r|}{|r|}\):
\[ F_1 = \frac{2PR}{P+R} \]
- Direction: Higher is better.
Perplexity (PPL)
- What it measures: Fluency via average inverse probability under a language model.
- Equation: For token sequence \(x_{1:T}\) with LM probabilities \(p(x_t\mid x_{<t})\):
\[ \mathrm{PPL} = \exp\!\left( -\frac{1}{T} \sum_{t=1}^T \ln p(x_t\mid x_{<t}) \right) \]
- Direction: Lower is better.
pass@k (code generation)
- What it measures: Probability a correct solution appears within \(k\) samples, under simple sampling without replacement (Codex estimator).
- Equation: With \(n\) samples and \(c\) correct among them:
\[ \mathrm{pass@}k = 1 - \frac{\binom{n-c}{k}}{\binom{n}{k}} \quad (n\ge k) \]
- Direction: Higher is better.
Expected Calibration Error (ECE)
- What it measures: Calibration gap between predicted confidences and empirical accuracies.
- Equation: With bins \(B_m\) and confidences/accuracies per bin:
\[ \mathrm{ECE} = \sum_{m=1}^M \frac{|B_m|}{N} \left| \mathrm{acc}(B_m) - \mathrm{conf}(B_m) \right| \]
- Direction: Lower is better.
Distinct-n (diversity)
- What it measures: Proportion of unique n-grams in the output set.
- Equation:
\[ \mathrm{Distinct}\,n = \frac{\#\,\text{unique n-grams}}{\#\,\text{all n-grams}} \]
- Direction: Higher is better.
When to use these
- Use BLEU/METEOR for MT-like tasks with short-form outputs.
- Use EM/F1 for extractive QA and short factual answers.
- Add Perplexity for fluency checks with a reference LM.
- Add pass@k for code tasks with unit tests.
- Track ECE when you surface confidence scores to users.
- Track Distinct-n to monitor mode collapse and promote diversity.
What we deliberately didn't reinvent
It would be dishonest to pretend the rest of the ecosystem is empty. It is excellent, and SQUER Metrics stands on its shoulders. EleutherAI's lm-evaluation-harness is the reproducibility standard for academic benchmarks, and it can already load any HuggingFace evaluate metric by name. The UK AI Security Institute's Inspect AI sets the bar for agentic and safety evaluations and for rigorous run logs. DeepEval brings a deep catalogue of LLM-as-judge metrics with a clean Pytest workflow; RAGAS leads on retrieval-augmented evaluation; Arize Phoenix and Langfuse are first-rate for production tracing and observability.
We did not try to out-benchmark Eleuther or out-trace Phoenix. Provider abstraction, parallelism, rate limiting, and judge caching are, frankly, table stakes today: several of these tools do them well, and we simply made sure ours were solid rather than novel. What none of them offers in one place is the thing we actually needed: a single registry that puts classic overlap metrics, learned semantic scores, safety classifiers, and LLM judges behind one interface, lets a use case pick exactly the ones it cares about, and carries those same numbers from model selection through testing and into long-run observability. That composition layer — unifying what is already out there rather than inventing more of it — is where SQUER Metrics earns its place.
Key takeaways
Return to the question we opened with: is this model good enough to ship? With SQUER Metrics, that is no longer a scavenger hunt across five tools and four formats. It is one command, one registry of metrics chosen per use case, one parallel run across whichever providers we care about, and one reproducible JSONL file that selection, testing, and production all read from. A trustworthy LLM evaluation framework is the difference between guessing and knowing, and the way to get there was not to breed more metrics, but to build one place that can tame the whole zoo.


